Police Officer Salary in Missouri: $68,250 (2026)
Quick Answer:Across Missouri's 33 metropolitan areas, the average median police officer pay sits at $68,250/year heading into 2026 — a figure projected from 2025 BLS OEWS wage data for SOC 33-3051. Because Missouri sits at BEA RPP 89.6 (10% below the U.S. baseline), that statewide median translates to roughly $76,172 in nationally-comparable purchasing power. Highest-paying metros: St. Louis ($73,240), Kansas City ($62,960), Columbia ($62,080).
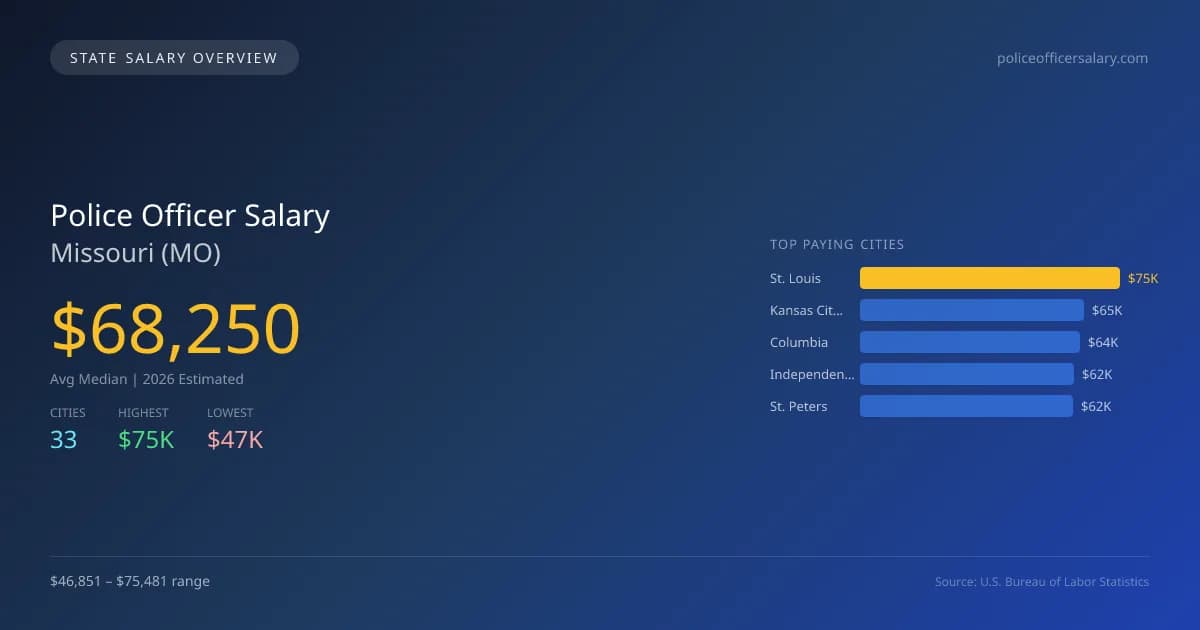
In Missouri, the projected average median salary for police officers in 2026 is $68,250, which is 13.1% lower than the national median of $78,542. The salary range varies significantly across the state, with St. Louis offering the highest average at $75,481, while Joplin has the lowest at $46,851. This disparity often stems from factors such as the cost of living, budget allocations for law enforcement, and local crime rates, which can impact both demand and salary levels. The job market for police officers in Missouri is expected to grow at an annual rate of 3.06%. Key demand drivers include urbanization, community safety concerns, and initiatives aimed at increasing public safety personnel. Candidates must be aware of state-specific factors such as licensing requirements, which typically include completion of a training academy and passing a civil service exam. The top five cities for police officer salaries in 2026 include St. Louis ($75,481), Kansas City ($64,887), Columbia ($63,980), Independence ($62,222), and St. Peters ($61,768). Understanding these dynamics can help prospective candidates navigate their career paths effectively in Missouri.
Missouri Police Officer Salary Range
Overall salary range in Missouri: $36,002 (lowest entry-level) to $99,638 (highest top earner)
Missouri vs National Average
Missouri police officers earn 13.1% less than the national median ($-10,292/year difference).
Missouri Police Officer Salary Distribution (2026)
Police Officer salaries in Missouri range from $48,107 (entry-level, 10th percentile) to $94,098 (top earners, 90th percentile), with a median of $68,250. The Missouri median is $10,292 below the US national median of $78,542. The average hourly rate is $32.81/hr. Approximately 13,712 police officers are employed across 33 cities.
2019 BLS Actual
$56,076
2025 BLS Actual
$66,224
2026 Current Est.
$68,250
2019–2027 Growth
+25.4%
Salary Trajectory for Police Officers in Missouri (2019–2027)
2019–2025: actual BLS OEWS data for this metro area. 2026+: CAGR 3.06% projection.
| Year | Annual Salary | Status |
|---|---|---|
| 2019 | $56,076 | Actual |
| 2020 | $58,233 | Actual |
| 2021 | $59,713 | Actual |
| 2022 | $56,930 | Actual |
| 2023 | $61,913 | Actual |
| 2024 | $65,733 | Actual |
| 2025 | $66,224 | Actual |
| 2026(current) | $68,250 | Estimated |
| 2027 | $70,339 | Projected |
Based on 7 years of BLS OEWS data for the Missouri metropolitan area, the median police officer salary grew 18.1% from $56,076 (2019) to $66,224 (2025). At a 3.06% compound annual growth rate, salaries are projected to reach $70,339 by 2027 — a total increase of $14,263 (25.44%) from 2019.
Note: Historical values (2019–2025) are actual BLS OEWS figures for the Missouri metropolitan area, sourced from annual Occupational Employment and Wage Statistics surveys. 2026–2026 figures are current estimates, and 2027 values are projections, calculated using a 3.06% CAGR derived from 7-year BLS historical data. Actual salaries may vary based on employer, experience, certifications, and local market conditions.
Top 5 Highest Paying Cities in Missouri
Lowest Paying Cities in Missouri
Best Value Cities for Police Officers in Missouri
When adjusted for local cost of living, these Missouri cities offer the most purchasing power for police officers.
| City | Nominal Salary | CoL Index | Adjusted Salary |
|---|---|---|---|
| St. Louis | $75,481 | 95.088 | $79,380 |
| Columbia | $63,980 | 89.438 | $71,536 |
| Jefferson City | $61,692 | 87.975 | $70,124 |
| Kansas City | $64,887 | 92.543 | $70,116 |
| Independence | $62,222 | 89.6 | $69,444 |
Adjusted salary = nominal salary × (100 / CoL index). CoL index: 100 = national average. Lower index = lower cost of living.
Salary by Experience Level in Missouri
| Experience Level | Estimated Annual |
|---|---|
| Entry Level (0-2 years) | $48,107 |
| Mid Career (3-7 years) | $68,250 |
| Experienced (7+ years) | $94,098 |
Estimates based on BLS percentile data averaged across Missouri metro areas. Individual pay varies by employer, certifications, and specialization.
All 33 Cities in Missouri
| # | City | Median Salary |
|---|---|---|
| 1 | St. Louis | $75,481 |
| 2 | Kansas City | $64,887 |
| 3 | Columbia | $63,980 |
| 4 | Independence | $62,222 |
| 5 | St. Peters | $61,768 |
| 6 | Jefferson City | $61,692 |
| 7 | St. Charles | $61,653 |
| 8 | O'Fallon | $60,937 |
| 9 | Florissant | $60,619 |
| 10 | Wildwood | $60,486 |
| 11 | Kirkwood | $60,468 |
| 12 | Lee's Summit | $60,434 |
| 13 | Chesterfield | $60,426 |
| 14 | Springfield | $60,249 |
| 15 | University City | $60,109 |
| 16 | Liberty | $60,085 |
| 17 | Grandview | $59,981 |
| 18 | St. Joseph | $59,950 |
| 19 | Maryland Heights | $59,882 |
| 20 | Blue Springs | $59,204 |
| 21 | Raytown | $58,850 |
| 22 | Webster Groves | $58,557 |
| 23 | Sedalia | $58,538 |
| 24 | Ballwin | $58,434 |
| 25 | Nixa | $58,429 |
| 26 | Gladstone | $58,273 |
| 27 | Wentzville | $58,136 |
| 28 | Cape Girardeau | $57,724 |
| 29 | Belton | $57,645 |
| 30 | Branson | $56,658 |
| 31 | Raymore | $56,443 |
| 32 | Hannibal | $56,259 |
| 33 | Joplin | $46,851 |
More Missouri Salary Data
Senior / Experienced
Top earner salaries for experienced police officers.
Compare Cities in Missouri
View all comparisons →Explore More Police Officer Salary Data
Frequently Asked Questions
How much do police officers make in Missouri in 2026?
What is the highest paying city for police officers in Missouri?
How does Missouri police officer pay compare to the national average?
What is the entry-level police officer salary in Missouri?
How many police officers are employed in Missouri?
Which Missouri city offers the best value for police officers?
Written by Jordan Lee, BA Criminal Justice
Career Analyst
Jordan Lee has over 10 years of experience in law enforcement. They specialize in community policing strategies. Jordan works with a municipal police department.
Methodology & Data Source
Statewide salary figures on this page are 2026 projections based on the Bureau of Labor Statistics Occupational Employment and Wage Statistics (OEWS) survey, May 2026 release. A 3.06% compound annual growth rate (CAGR), derived from 6-year national BLS wage trends, was applied to each metro area's reported salary to estimate current 2026 police officer compensation across Missouri. State averages are employment-weighted across 33 metro areas — larger metro areas with more police officerscontribute proportionally more to the average, producing figures that better reflect typical compensation. Individual pay varies by city, employer, certifications, and experience.
Data Sources & Methodology
Source: BLS, OEWS, 7-year dataset (–). Per-city data from annual BLS metropolitan area surveys.
2026 figures are projected from 2025 BLS data using a compound annual growth rate (CAGR) of 3.06%, derived from historical BLS wage trends for police officers (SOC 33-3051).
Compiled and verified by Jordan Lee, BA Criminal Justice, a licensed police officer with 10+ years of clinical experience. · View source data at BLS.gov